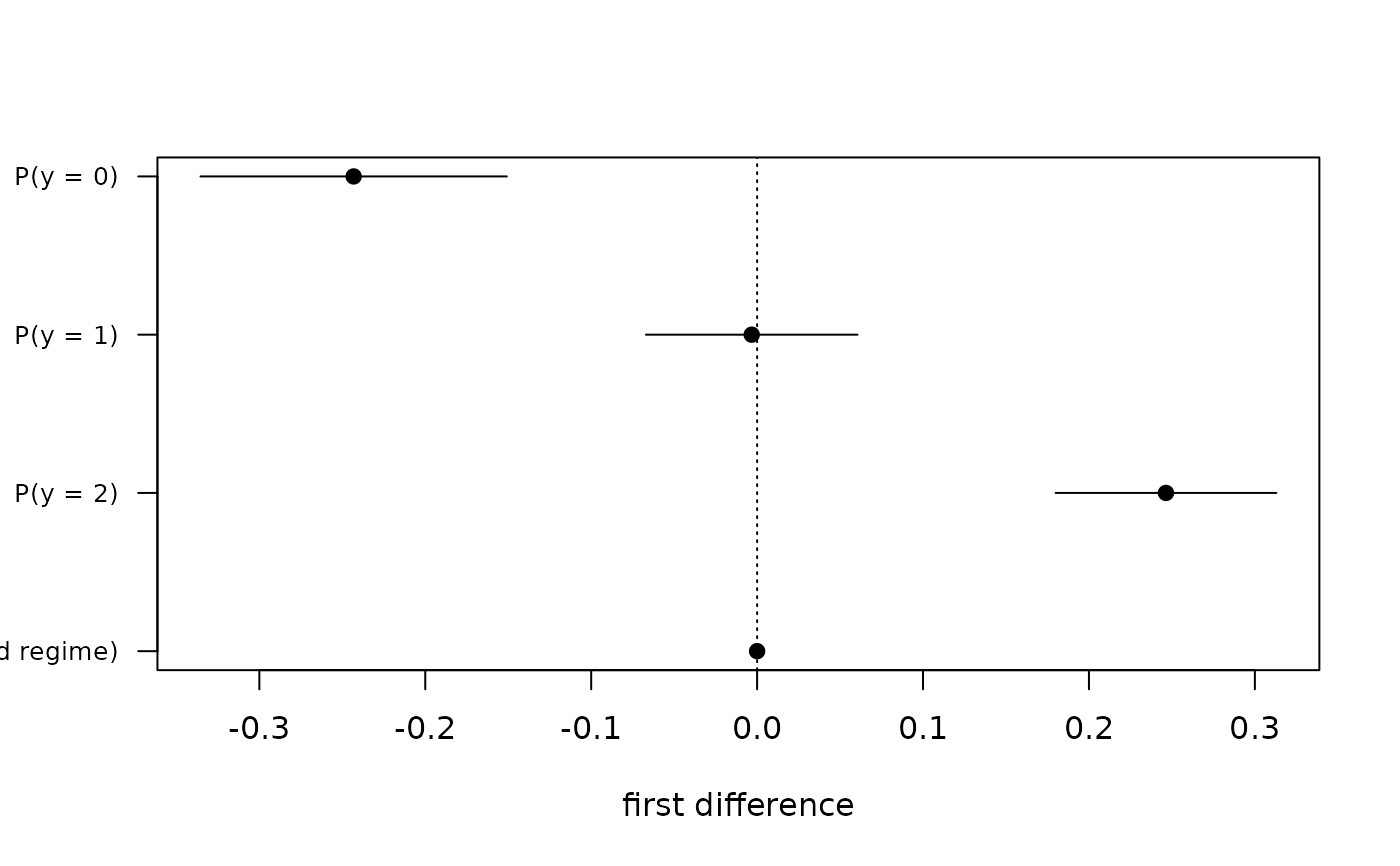
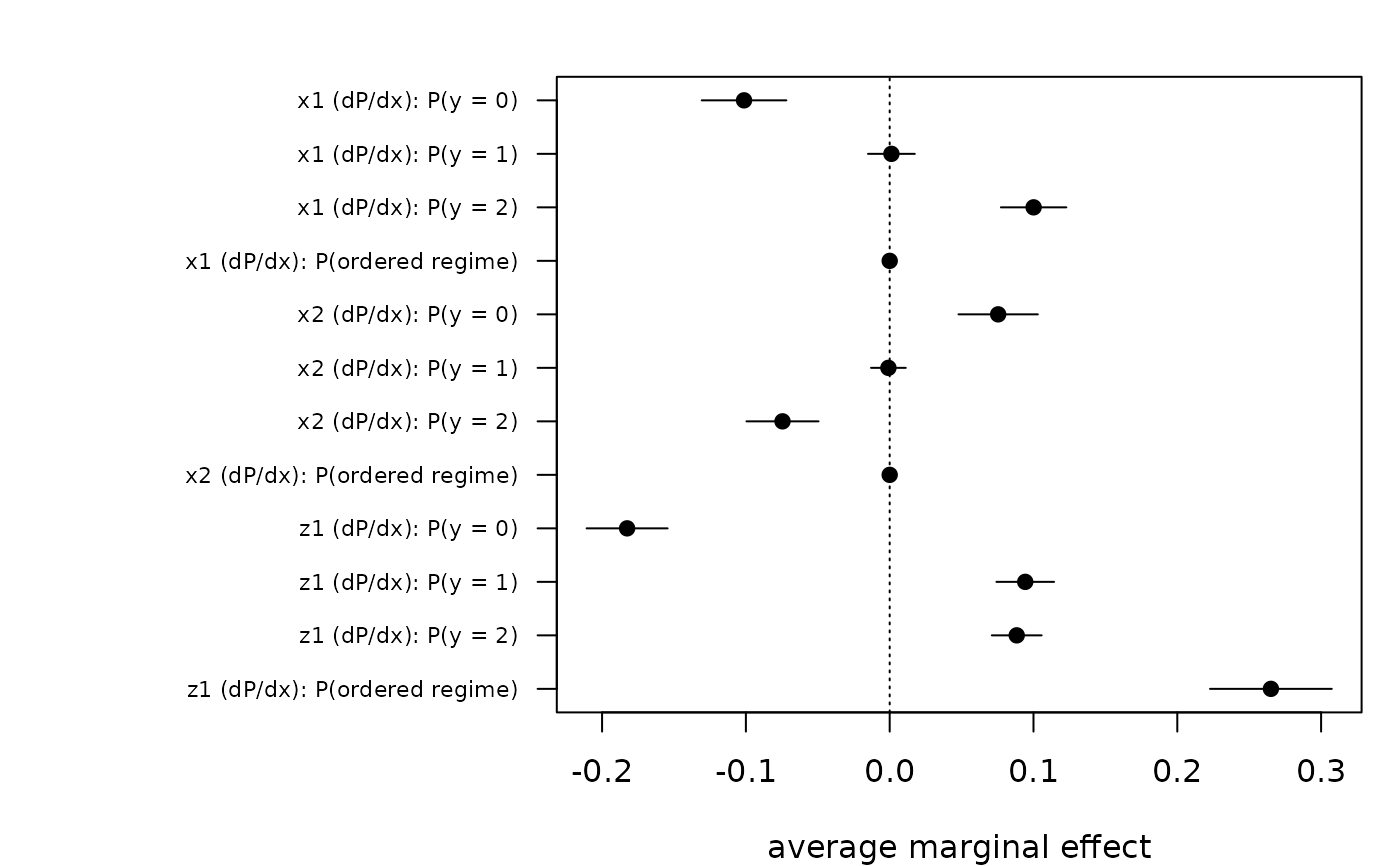
A dot-and-whisker display of the estimates and their intervals, one point
per component (category / regime), grouped by variable for ame() tables.
Arguments
- x
An object from
first_difference()orame().- ...
Passed to
graphics::plot()(e.g.main).
See also
Other quantities of interest:
ame(),
first_difference(),
predict.iord()